











 Adam Driscoll
PowerShell Universal currently integrates with Application Insights to provide metrics to Azure from instances of the platform. You can see that setup in the monitoring documentation. While this is plug-and-play ready, collecting metrics in the cloud may not be useful to all users. In an effort to provide isolated instances the ability to collect metrics, we have created a new plugin that integrates with OpenTelemetry.
OpenTelemetry
As defined on the OpenTelemetry site, OpenTelemetry is a collection of APIs, SDKs, and tools. Use it to instrument, generate, collect, and export telemetry data (metrics, logs, and traces) to help you analyze your software’s performance and behavior.
OpenTelemetry provides a library and NuGet packages for generating metrics and logs in .NET and ASP.NET Core applications. By introducing OpenTelemetry into PowerShell Universal, we can easily provide metrics to tools like Prometheus.
Configuring PowerShell Universal metrics with Prometheus
As part of our new plugin system development, we are producing plugins to ensure the viability of the framework. Starting this evening, PowerShell Universal v4.2 nightly builds will ship with a new PowerShellUniversal.Plugin.OpenTelemetry plugin to expose metrics to external services like Prometheus. You can also see the current OpenTelemetry plugin documentation.
Enabling OpenTelemetry
To enable this plugin, we’ve introduced two methods of configuration. First, you can now use the appsettings.json file to load plugin modules found on the $ENV:PSModulePath. We’ll be shipping the OpenTelemetry module within PSU, at least for the moment, and it can be loaded using the following JSON.
{
    "Plugins": [
        "UniversalAutomation.LiteDBv5",
        "PowerShellUniversal.Plugin.OpenTelemetry"
    ]
}
If you are using a different persistence plugin, you will want to replace that LiteDBv5 value with that value instead.
Additionally, you can also use the plugins.ps1 file in the Repository\.universal directory to load plugins. Import the module in this file. You will have to create it if it does not exist. Changes to this file require a restart of the PowerShell Universal service.
Import-Module PowerShellUniversal.Plugin.OpenTelemetrySending metrics to Prometheus
Once enabled, you will need to configure the target endpoint for your metric data. By default, Prometheus listens for metrics at the following URL: http://localhost:9090/api/v1/otlp/v1/metrics.
You will need to update appsettings.json or create environment variables that pass this value to the PSU configuration system. An example JSON configuration looks like this.
{
    "OpenTelemetry": {
        "Otlp": {
            "Endpoint": "http://localhost:9090/api/v1/otlp/v1/metrics"
        }
    }
}
An example environment variable would be like this.
$Env:OpenTelemetry__Otlp__Endpoint = 'http://localhost:9090/api/v1/otlp/v1/metrics'OTLP stands for OpenTelemetry Protocol. While there are more configuration options we will expose for this plugin, this is currently the only option available.
With the OTLP endpoint configured, we can now run Prometheus to collect metrics. Download the latest version of Prometheus and start it with the OTLP feature enabled.
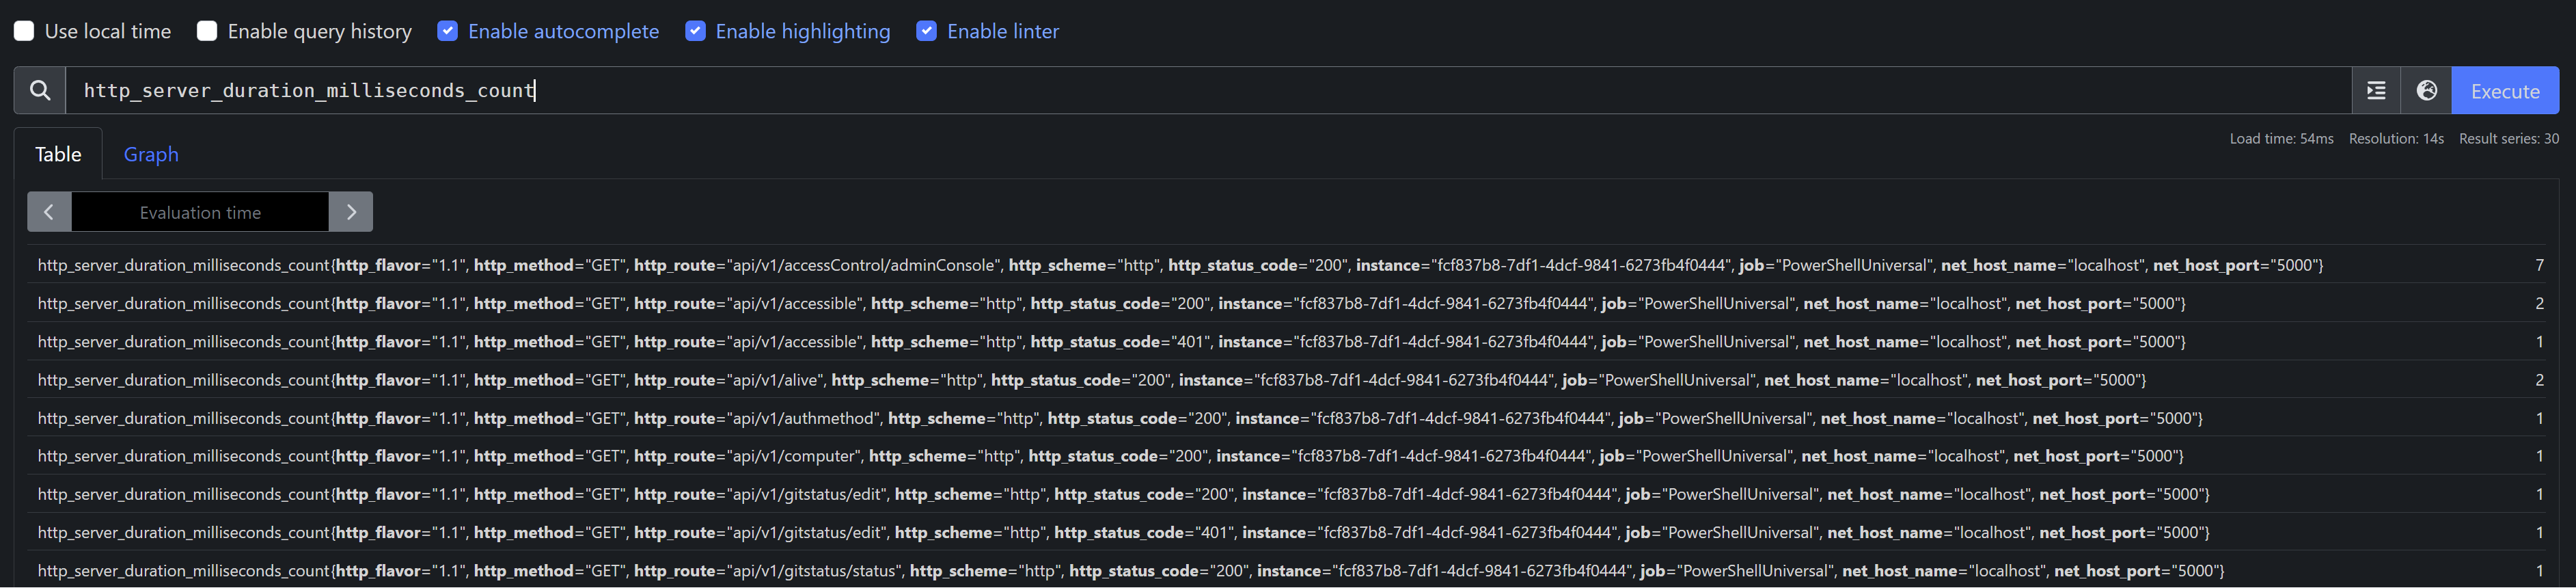
prometheus --enable-feature=otlp-write-receiverOnce Prometheus is running, you can access the dashboard by visiting http://localhost:9090. Enter the metric named http_server_duration_milliseconds_count and press Execute. You’ll see that Prometheus is listing the number of HTTP requests coming into the PowerShell Universal service. The _sum series is the accumulated duration in milliseconds.
Conclusion
Locally controlled operational metrics are a great feature for any service running in your environment. We hope to provide additional configuration options for the OpenTelemetry plugin in the future. This will include providing cmdlets for generating custom metrics in your PowerShell scripts that run within PowerShell Universal. Note that the functionality described above will only function in nightly builds starting on October 3, 2023, and will ship in version 4.2 of PowerShell Universal.
As our plugin system evolves, some changes may be made to how it works, so we do not recommend creating new plugins at this time. We will be releasing a publicly accessible NuGet package and documentation with version 5 of PowerShell Universal.
Please reach out with feedback or questions on the forums.
Ready to build? Download PowerShell Universal.