











 Adam Driscoll
PowerShell Universal (and its predecessor Universal Dashboard) have always been tricky to debug. Almost all of the functionality is accomplished via background runspaces, so stepping through with a debugger requires some wrangling of tools. It also doesn’t work remotely: until now.
PowerShell Universal Debugger for VS Code
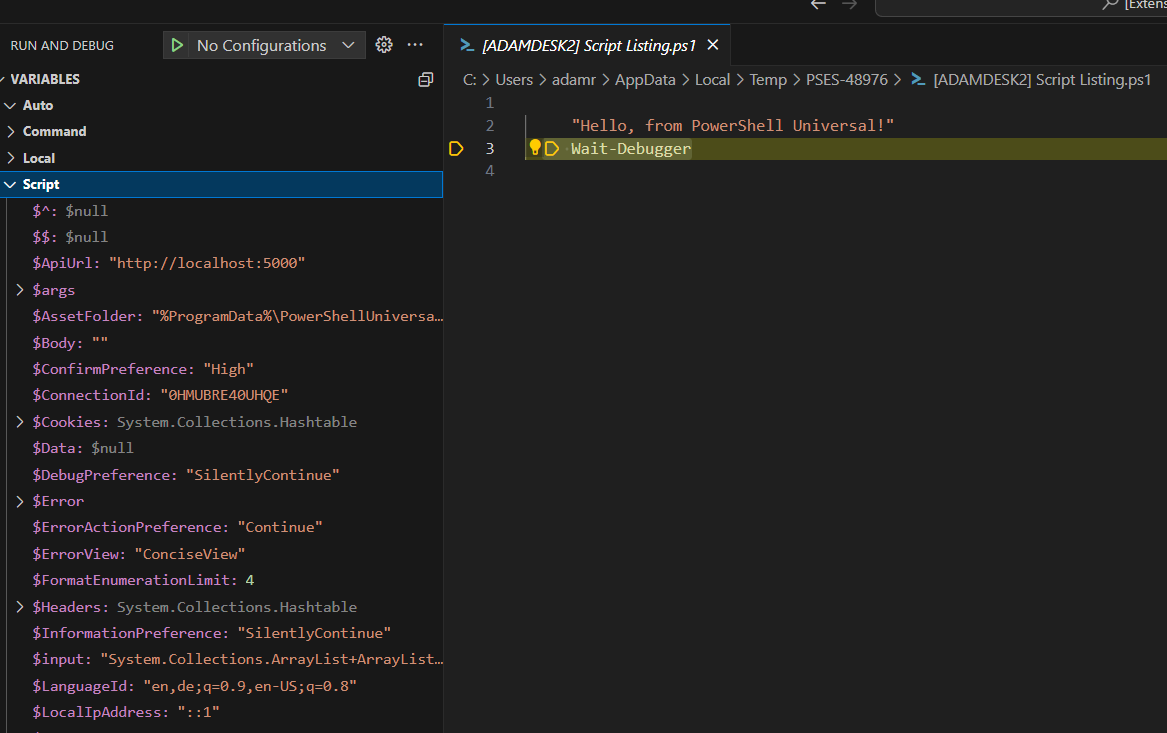
Shipping with version 4.2 of PowerShell Universal and the Universal VS Code extension, we’re adding the ability to debug scripts, Apps, and APIs directly from VS Code. This lets you set breakpoints (typically through Wait-Debugger), step through code, and inspect variables. It works remotely over a WebSocket connection to the PowerShell Universal server.
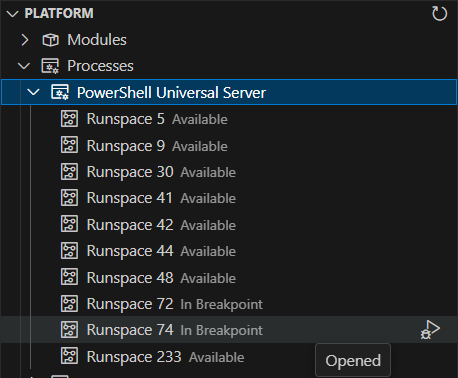
A new Processes view under the Platform tree view provides a connection to all of the runspaces running on the server that are managed by PowerShell Universal. You can select a process and click the Attach button to attach the debugger to the process.
Once attached, you’ll have the full PowerShell debugging experience in Visual Studio Code. You can view your code, step through it, and inspect variables.
While this is a pretty amazing experience, it’s mostly provided by hosting an instance of PowerShell Editor Services within the PSU service and communicating directly to it via a WebSocket. We’ll jump into the technical details below.
Debug Adapter Protocol
The Debug Adapter Protocol is a specification for implementing debuggers. It’s integrated into both Visual Studio Code and Visual Studio so a single implementation of the protocol can work in both editors. In the PowerShell world, this is PowerShell Editor Services.
VS Code sends JSON formatted requests to the PowerShell Editor Services process, and PowerShell Editor Services responds with JSON formatted responses. Rather than having to completely rewrite a debugger, we can now take advantage of it to provide debugging services.
PowerShell Editor Services
PowerShell Editor Services is a Debug Adapter Protocol server implementation. It effectively ships as a PowerShell module that is loaded into a PowerShell process and then communicates via RPC. It’s the same implementation that is used in the PowerShell extension for Visual Studio Code. To work with the services, you start a PowerShell process with the proper editor services command line arguments.
This typically looks something like this.
pwsh -NoLogo -NoProfile -Command "$PSES_BUNDLE_PATH/PowerShellEditorServices/Start-EditorServices.ps1 -BundledModulesPath $PSES_BUNDLE_PATH -LogPath $SESSION_TEMP_PATH/logs.log -SessionDetailsPath $SESSION_TEMP_PATH/session.json -FeatureFlags @() -AdditionalModules @() -HostName 'My Client' -HostProfileId 'myclient' -HostVersion 1.0.0 -LogLevel Normal"From there, we can then read the session.json file written by the service. By default, this includes named pipe names that can be used for the Language Service Protocol as well as the Debug Adapter Protocol. Once a named pipe is connected, we can send and receive JSON messages to control the debugger and receive information about the current state of the runspace.
Wiring up PowerShell Universal
Rather than expose a named pipe externally, it’s much easier to expose a WebSocket that can then use the same authentication, authorization, and port of the web server. We’ve added a new SignalR hub that receives strings from a client and then sends them to the PowerShell Editor Services process.
We effectively are channeling the messages through. There was some work necessary to adapt to the DAP protocol and named pipe communications, but it was minimal. We start PSES in a new process and only start the debugger service, not the language service.
Hooking up the VS Code Debugger
Now that we have a WebSocket and PowerShell Editor Services process running, we can integrate it into tools like VS Code. Effectively, we’ve implemented a custom debug adapter. This would typically be a lot of work, but because we are actually communicating with PSES over the WebSocket, we can funnel requests and responses without having to implement the entire protocol.
export class UniversalDebugAdapter implements vscode.DebugAdapter {

    constructor(context: vscode.ExtensionContext) {
        const connectionName = context.globalState.get("universal.connection");
        const settings = load();

        var appToken = settings.appToken;
        var url = settings.url;
        var rejectUnauthorized = true;
        var windowsAuth = false;

        if (connectionName && connectionName !== 'Default') {
            const connection = settings.connections.find(m => m.name === connectionName);
            if (connection) {
                appToken = connection.appToken;
                url = connection.url;
                rejectUnauthorized = !connection.allowInvalidCertificate;
            }
        }

        this.hubConnection = new HubConnectionBuilder()
            .withUrl(`${url}/debuggerhub`, { accessTokenFactory: () => appToken })
            .configureLogging(LogLevel.Information)
            .build();

        this.hubConnection.on("message", (message: string) => {
            const protocolMessage = JSON.parse(message) as DebugProtocol.ProtocolMessage;
            this.handleMessage(protocolMessage);
        });

        this.hubConnection.onclose(() => {
            vscode.window.showInformationMessage("Disconnected from PowerShell Universal Debugger.");
        });
    }

    private hubConnection: HubConnection;
    private sendMessage = new vscode.EventEmitter<DebugProtocol.ProtocolMessage>();

    readonly onDidSendMessage: vscode.Event<DebugProtocol.ProtocolMessage> = this.sendMessage.event;

    handleMessage(message: DebugProtocol.ProtocolMessage): void {
        if (this.hubConnection.state === 'Disconnected') {
            this.hubConnection.start().then(() => {
                this.handleMessage(message);
            });
            return;
        }

        switch (message.type) {
            case 'request':
                this.hubConnection.send("message", JSON.stringify(message));
                break;
            case 'response':
                this.sendMessage.fire(message);
                break;
            case 'event':
                this.sendMessage.fire(message);
                break;
        }
    }

    dispose() {
        this.hubConnection.stop();
    }
}
Once the debugger adapter was implemented, we added a tree view that allowed for selecting a process and runspace and then attaching to it. We already surfaced this information in the PowerShell Universal admin console, so it was trivial to show it in the VS Code tree view as well.
When the user selects a process and clicks the attach button, we send a request to the debug adapter to attach to the process and PSES takes over the rest.
export const attachRunspace = async (runspace: RunspaceTreeItem, context: vscode.ExtensionContext) => {
    await vscode.debug.startDebugging(undefined, {
        name: "PowerShell Universal",
        type: "powershelluniversal",
        request: "attach",
        processId: runspace.runspace.processId,
        runspaceId: runspace.runspace.id
    });
};
Conclusion
This new feature will be extremely helpful for users working with any type of PowerShell script in Universal. Albeit a bit of an advanced usage, it provides a much better debugging experience than what was previously available. This feature will ship as a plugin in PowerShell Universal v4.2. We will be deprecating the existing in-browser debugging experience and will be removing it in a future release.
It would be possible to extend this functionality beyond debugging PowerShell Universal scripts. It could expose a whole world of remote debugging PowerShell over WebSockets.
Ready to build? Download PowerShell Universal.